Skip to content →

The real estate data layer for AI

Give your AI the real estate data it's missing. Every parcel, zoning code, permit and ordinance in your markets, traced to its source.

Connect your assistant →

You've probably asked Claude, ChatGPT, or Grok for real estate data.

I bet it went something like this…

Blocked by bot detection

Downloaded gigabytes of data onto your laptop

Incomplete results and hallucinations

The dataset you needed did not exist

The data layer

Every kind of real estate data, piped into your agent.

Your assistant asks. Ploti finds the source, whether that is a county GIS server, a utility's hosting capacity map, or twenty years of meeting minutes, turns it into clean tables, and keeps it current.

Requests Ploti has already run

  • Which buildings can the grid still power?

    2.76M distribution circuit segments with hosting capacity, on one map with utility territories and substations.

    Powered land
  • Twenty years of rezoning votes, read in full

    324 cases rebuilt from 1,823 meeting documents, every vote linked to the page it came from.

    Land assemblage
  • Zoning for 15 counties in an afternoon

    57 county and city zoning layers, most of them ready within the hour.

    Land investing
  • Every delinquent account's full tax history

    1,421 accounts with their payment history, refreshed every week.

    Distressed acquisition
  • Billboard rules you can map

    16,486 regulated structures, checked against scenic highways and draft ordinance exclusion zones.

    Out-of-home advertising
  • Is there a water line within half a mile?

    10,744 potable water line segments for screening developable acreage.

    Homebuilding

Tell Ploti where you work

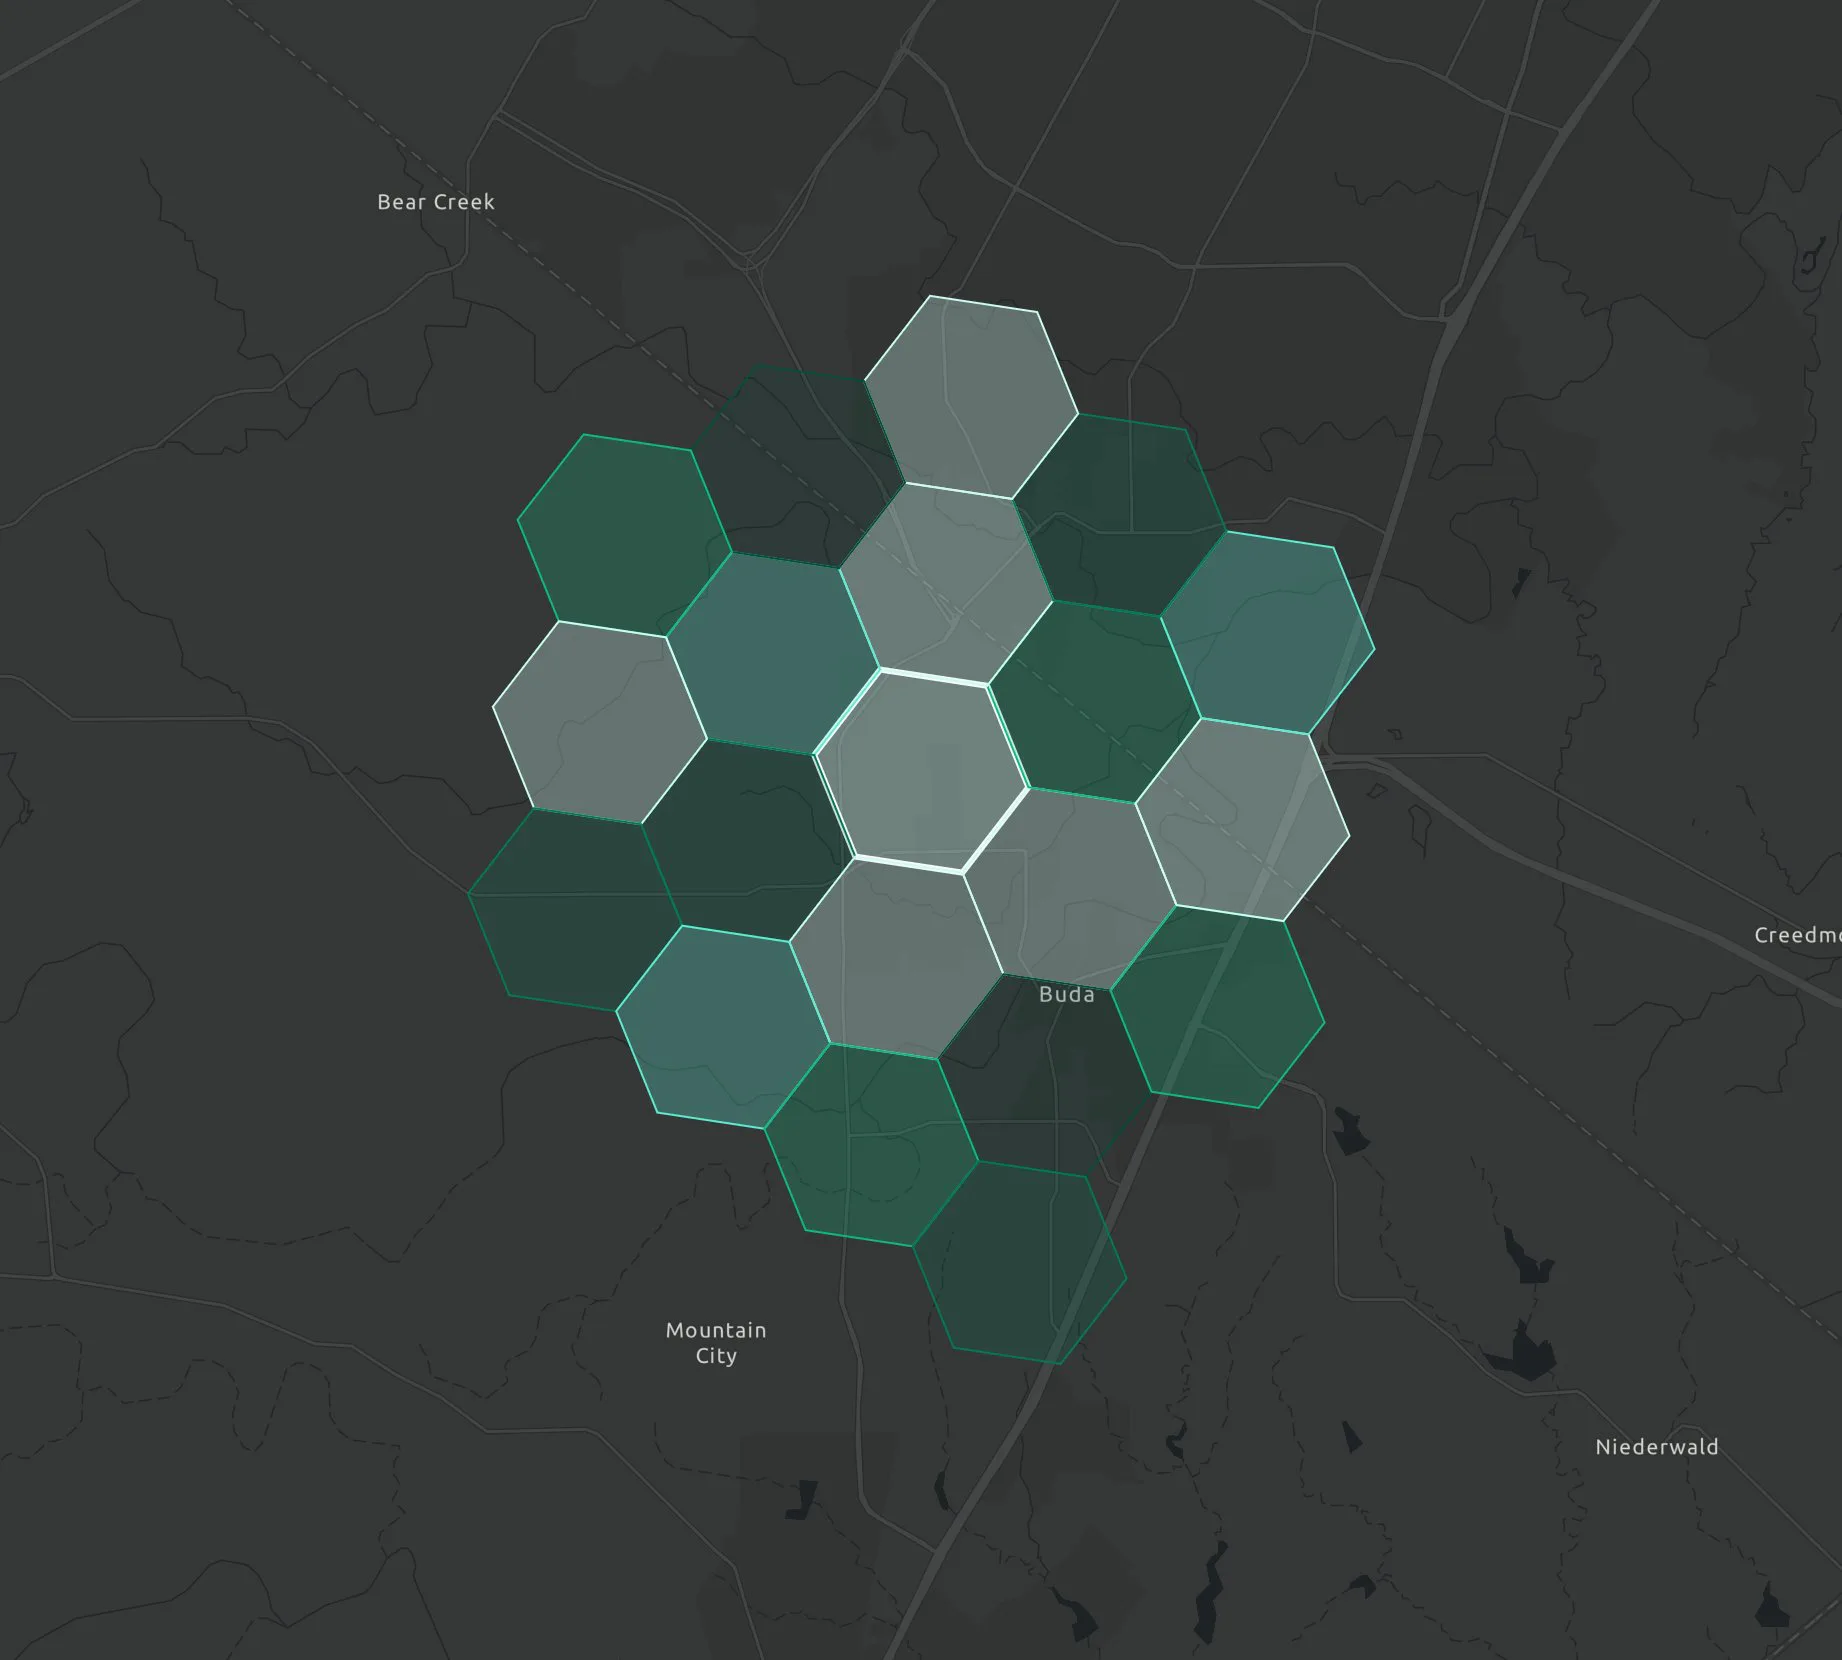
Pick the counties your team works in. Ploti finds, pulls, and maintains every dataset there automatically, and you pay only for the counties you cover.

Data AtlasCoverage map
Austin
San Marcos
Travis County42 coverage cells18 maintained datasets
Coverage density
Coverage areasSelected counties
7
Travis CountyCentral Texas
Active
Hays CountyCentral Texas
Active
Williamson CountyCentral Texas
Active
Comal CountyHill Country
Queued
Bexar CountySouth Texas
Queued
Data AtlasCoverage map
Austin
San Marcos
Travis County42 coverage cells18 maintained datasets
Coverage density
Coverage areasSelected counties
7
Travis CountyCentral Texas
Active
Hays CountyCentral Texas
Active
Williamson CountyCentral Texas
Active
Comal CountyHill Country
Queued
Bexar CountySouth Texas
Queued

Every request your agents make, in one place

When your agent needs data Ploti does not have yet, it files a request. Ploti sources it automatically and emails you when it is ready, and your agent can check on it for you. Every request from every agent on your team lands in one Ploti dashboard.

Data Agents
Data requestStatusRequested byAreaProgressUpdated
Traffic counts near target sitesDR-1042
Building datasetClaudeTravis County68% completeJust now
Driveway permits since 2020DR-1038
Ready, emailed youChatGPTHays County100% complete1 hr ago
Planned road projectsDR-1035
Answered from catalogGrokTravis County100% complete3 hr ago
Water and sewer service areasDR-1029
Searching sourcesClaudeComal County18% completeYesterday
Rezoning cases, last 10 yearsDR-1026
Request submittedYour agentBexar County8% complete2 days ago
Floodplain map revisionsDR-1021
Searching sourcesChatGPTHays County52% complete3 days ago
School district boundariesDR-1018
Answered from catalogClaudeWilliamson County100% complete4 days ago
Tax delinquent accountsDR-1014
Building datasetGrokBexar County73% complete5 days ago
Rezoning applications since 2018DR-1011
Ready, emailed youClaudeTravis County100% complete6 days ago
Septic permitsDR-1008
Dedicated agent assignedYour agentComal County26% complete1 week ago
Data agentActive request
Plotipicked up a request from Claude
Finding the county traffic count program...Thinking...
Plotiupdated your data requests
Worked for 9sMoved your requests forward:
Driveway permits is ready, and ChatGPT was told
Traffic counts is building its dataset
Preview
Changed5 requests+18 sources reviewed
DraftView request progress

Give your agent the power to draw maps

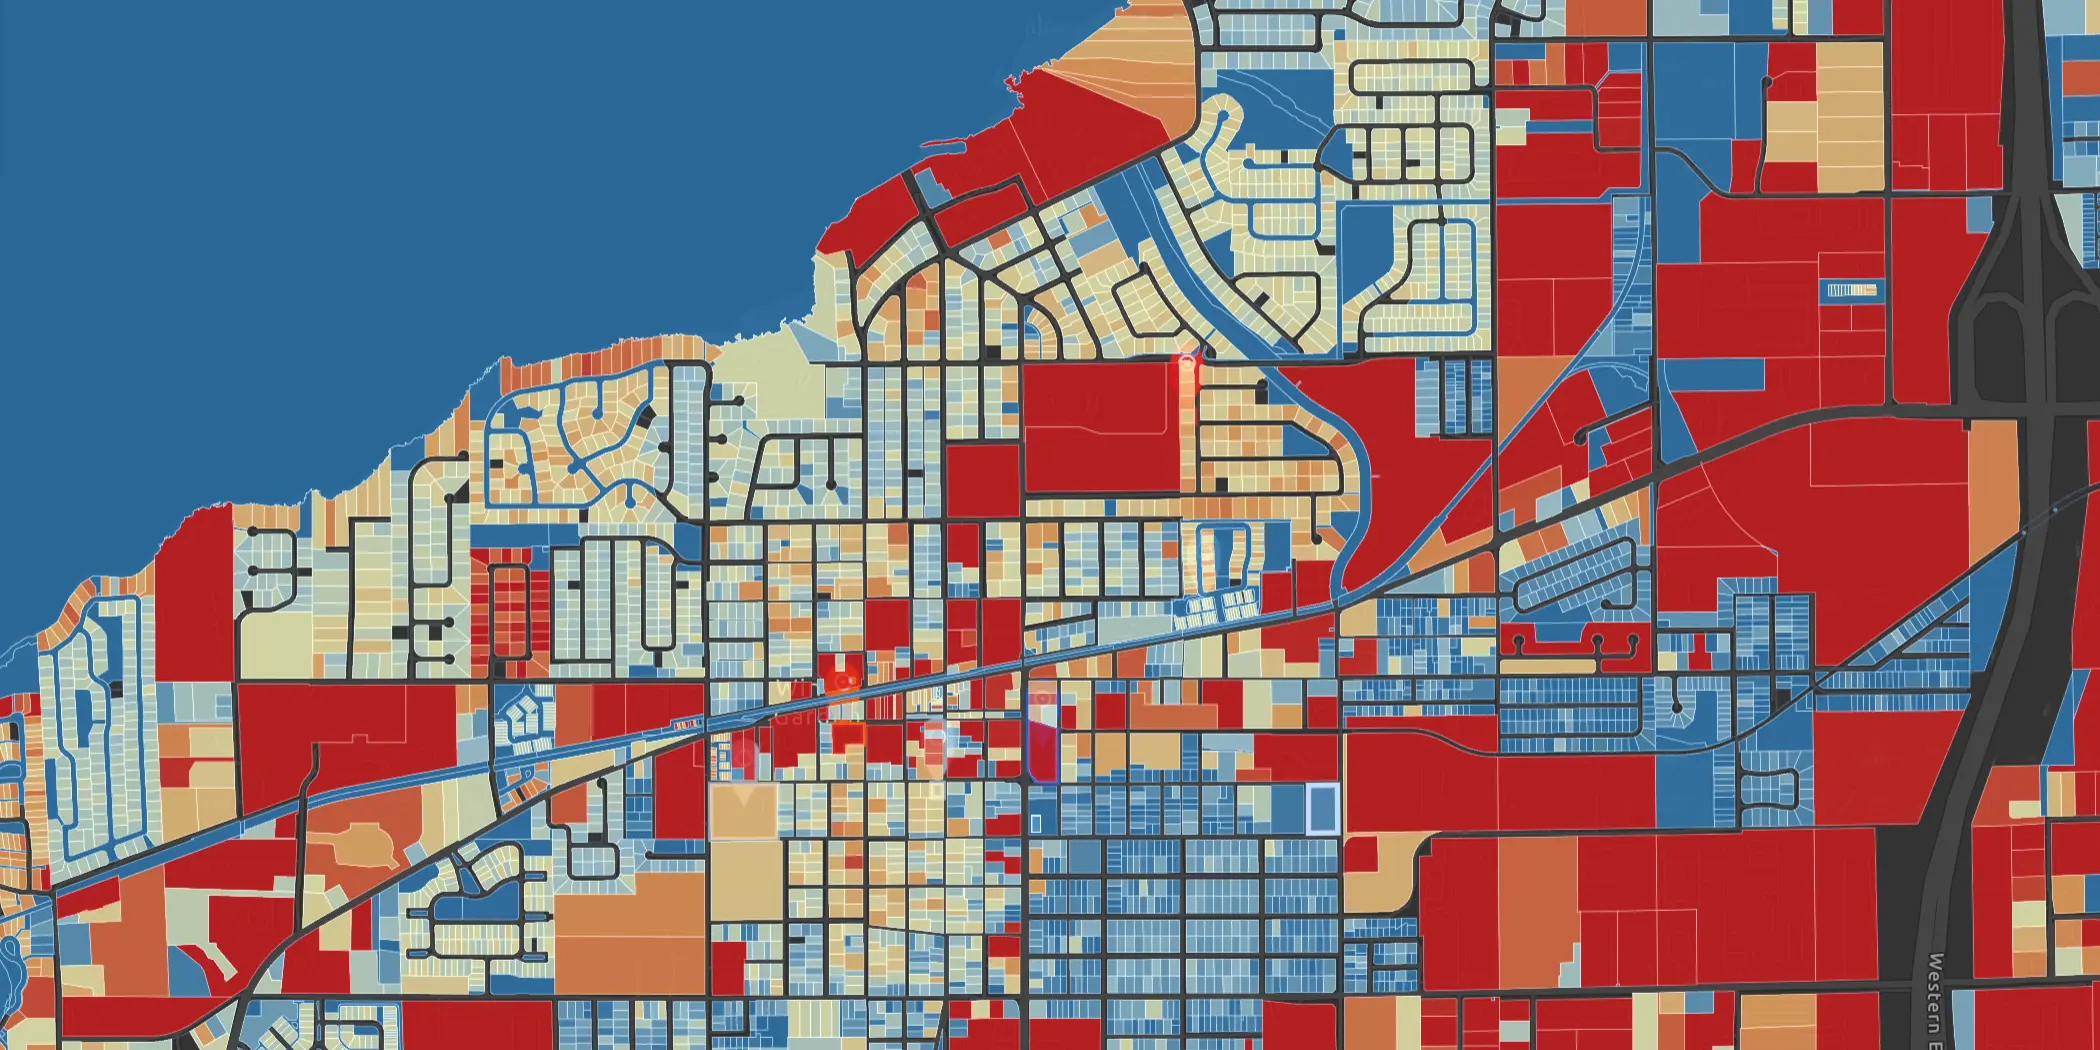
On their own, assistants answer in text. Ploti gives yours a map: it pulls every relevant layer, filters to the data that matters, and hands you a custom map built for your question, ready to open and share.

Ploti parcel value heatmap on an interactive map
PPloti chatMap workspace
Brennen
Brennen

Show me the parcel value heatmap by assessed value for this area.

Ploti

I shaded every parcel by assessed value so the highest-value properties stand out immediately on the map.

Parcel Values Heatmap
42,184 parcels

Parcels grouped by assessed value bands, with the highest-value properties highlighted for follow-up analysis.

Now isolate the highest assessed-value parcels near target corridors.
Ploti parcel value heatmap on an interactive map
Explore assessed value on the map

See parcels shaded by assessed value, then ask Ploti to isolate the properties that matter.

Built for the future. Available today.